Stats 2000-2013
Ran some quick numbers I wanted to share. These are based on Sagarin ratings. Higher the rating the stronger the team. I pulled all the ratings for teams we beat or lost to since 2000. I excluded the bowl games under June for a fair comparison. Let's take a look:
Average rating of teams we beat and teams we lost to:
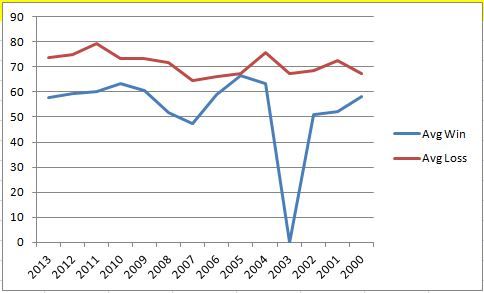
Looks like we have lost to slightly better teams on average lately, and that the end of Bennett beat a strong slate of teams, relatively. But this can be misleading as beating some awesome teams would be averaged out by having to play some garbage teams on the schedule. Vice-versa for losses.
If we look at only the best team beat and worst team lost to each year:
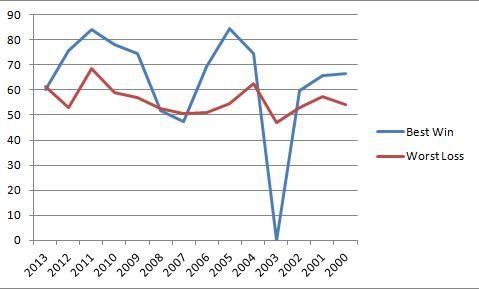
Interesting. Very cyclical. The JJ and PB best wins match in pattern. June has take less bad Tulane-esque losses compared to Phil.
Let's wipe out the one-off wins and losses and take the best three teams beat, and worst three teams lost to. I think this would be the best indicator:
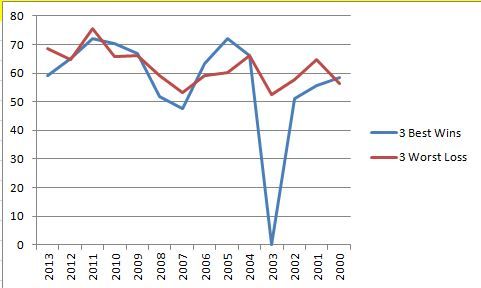
Very similar patterns between June and Phil on the win side. Our suspicions that we will crash even worst next year would be predicted by this pattern. You can even see the last two years of Cavan fitting the end of this pattern as well.
On the loss side, Phil lost to some worse teams than June has, but the pattern is the same. End of Cavan matches also. I think this is due to conference strength based on what I noticed entering the data.
One more interesting piece comparing strength. On wins over entire tenure:
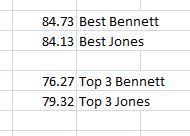
The best team ever beaten by either coach is about the same. The top three teams beaten by June are slightly better than the top by by Phil.... but not that different. The cycle repeats.
Average rating of teams we beat and teams we lost to:
Looks like we have lost to slightly better teams on average lately, and that the end of Bennett beat a strong slate of teams, relatively. But this can be misleading as beating some awesome teams would be averaged out by having to play some garbage teams on the schedule. Vice-versa for losses.
If we look at only the best team beat and worst team lost to each year:
Interesting. Very cyclical. The JJ and PB best wins match in pattern. June has take less bad Tulane-esque losses compared to Phil.
Let's wipe out the one-off wins and losses and take the best three teams beat, and worst three teams lost to. I think this would be the best indicator:
Very similar patterns between June and Phil on the win side. Our suspicions that we will crash even worst next year would be predicted by this pattern. You can even see the last two years of Cavan fitting the end of this pattern as well.
On the loss side, Phil lost to some worse teams than June has, but the pattern is the same. End of Cavan matches also. I think this is due to conference strength based on what I noticed entering the data.
One more interesting piece comparing strength. On wins over entire tenure:
The best team ever beaten by either coach is about the same. The top three teams beaten by June are slightly better than the top by by Phil.... but not that different. The cycle repeats.